Live: ---
Rail: 575.00-590.00 del
{{ weatherTemp }}°C
{{ weatherCity }}
AB Direct - Steers
AB Direct - Heifers
Live: ---
Rail: 575.00-590.00 del
Rail: 575.00-590.00 del
US Trade- Steers
Live: ---
Rail: ---
Rail: ---
US Trade - Heifers
Live: ---
Rail: ---
Rail: ---
Canadian Dollar
$71.54
0.00
0.00
June 12, 2026
Health & Production
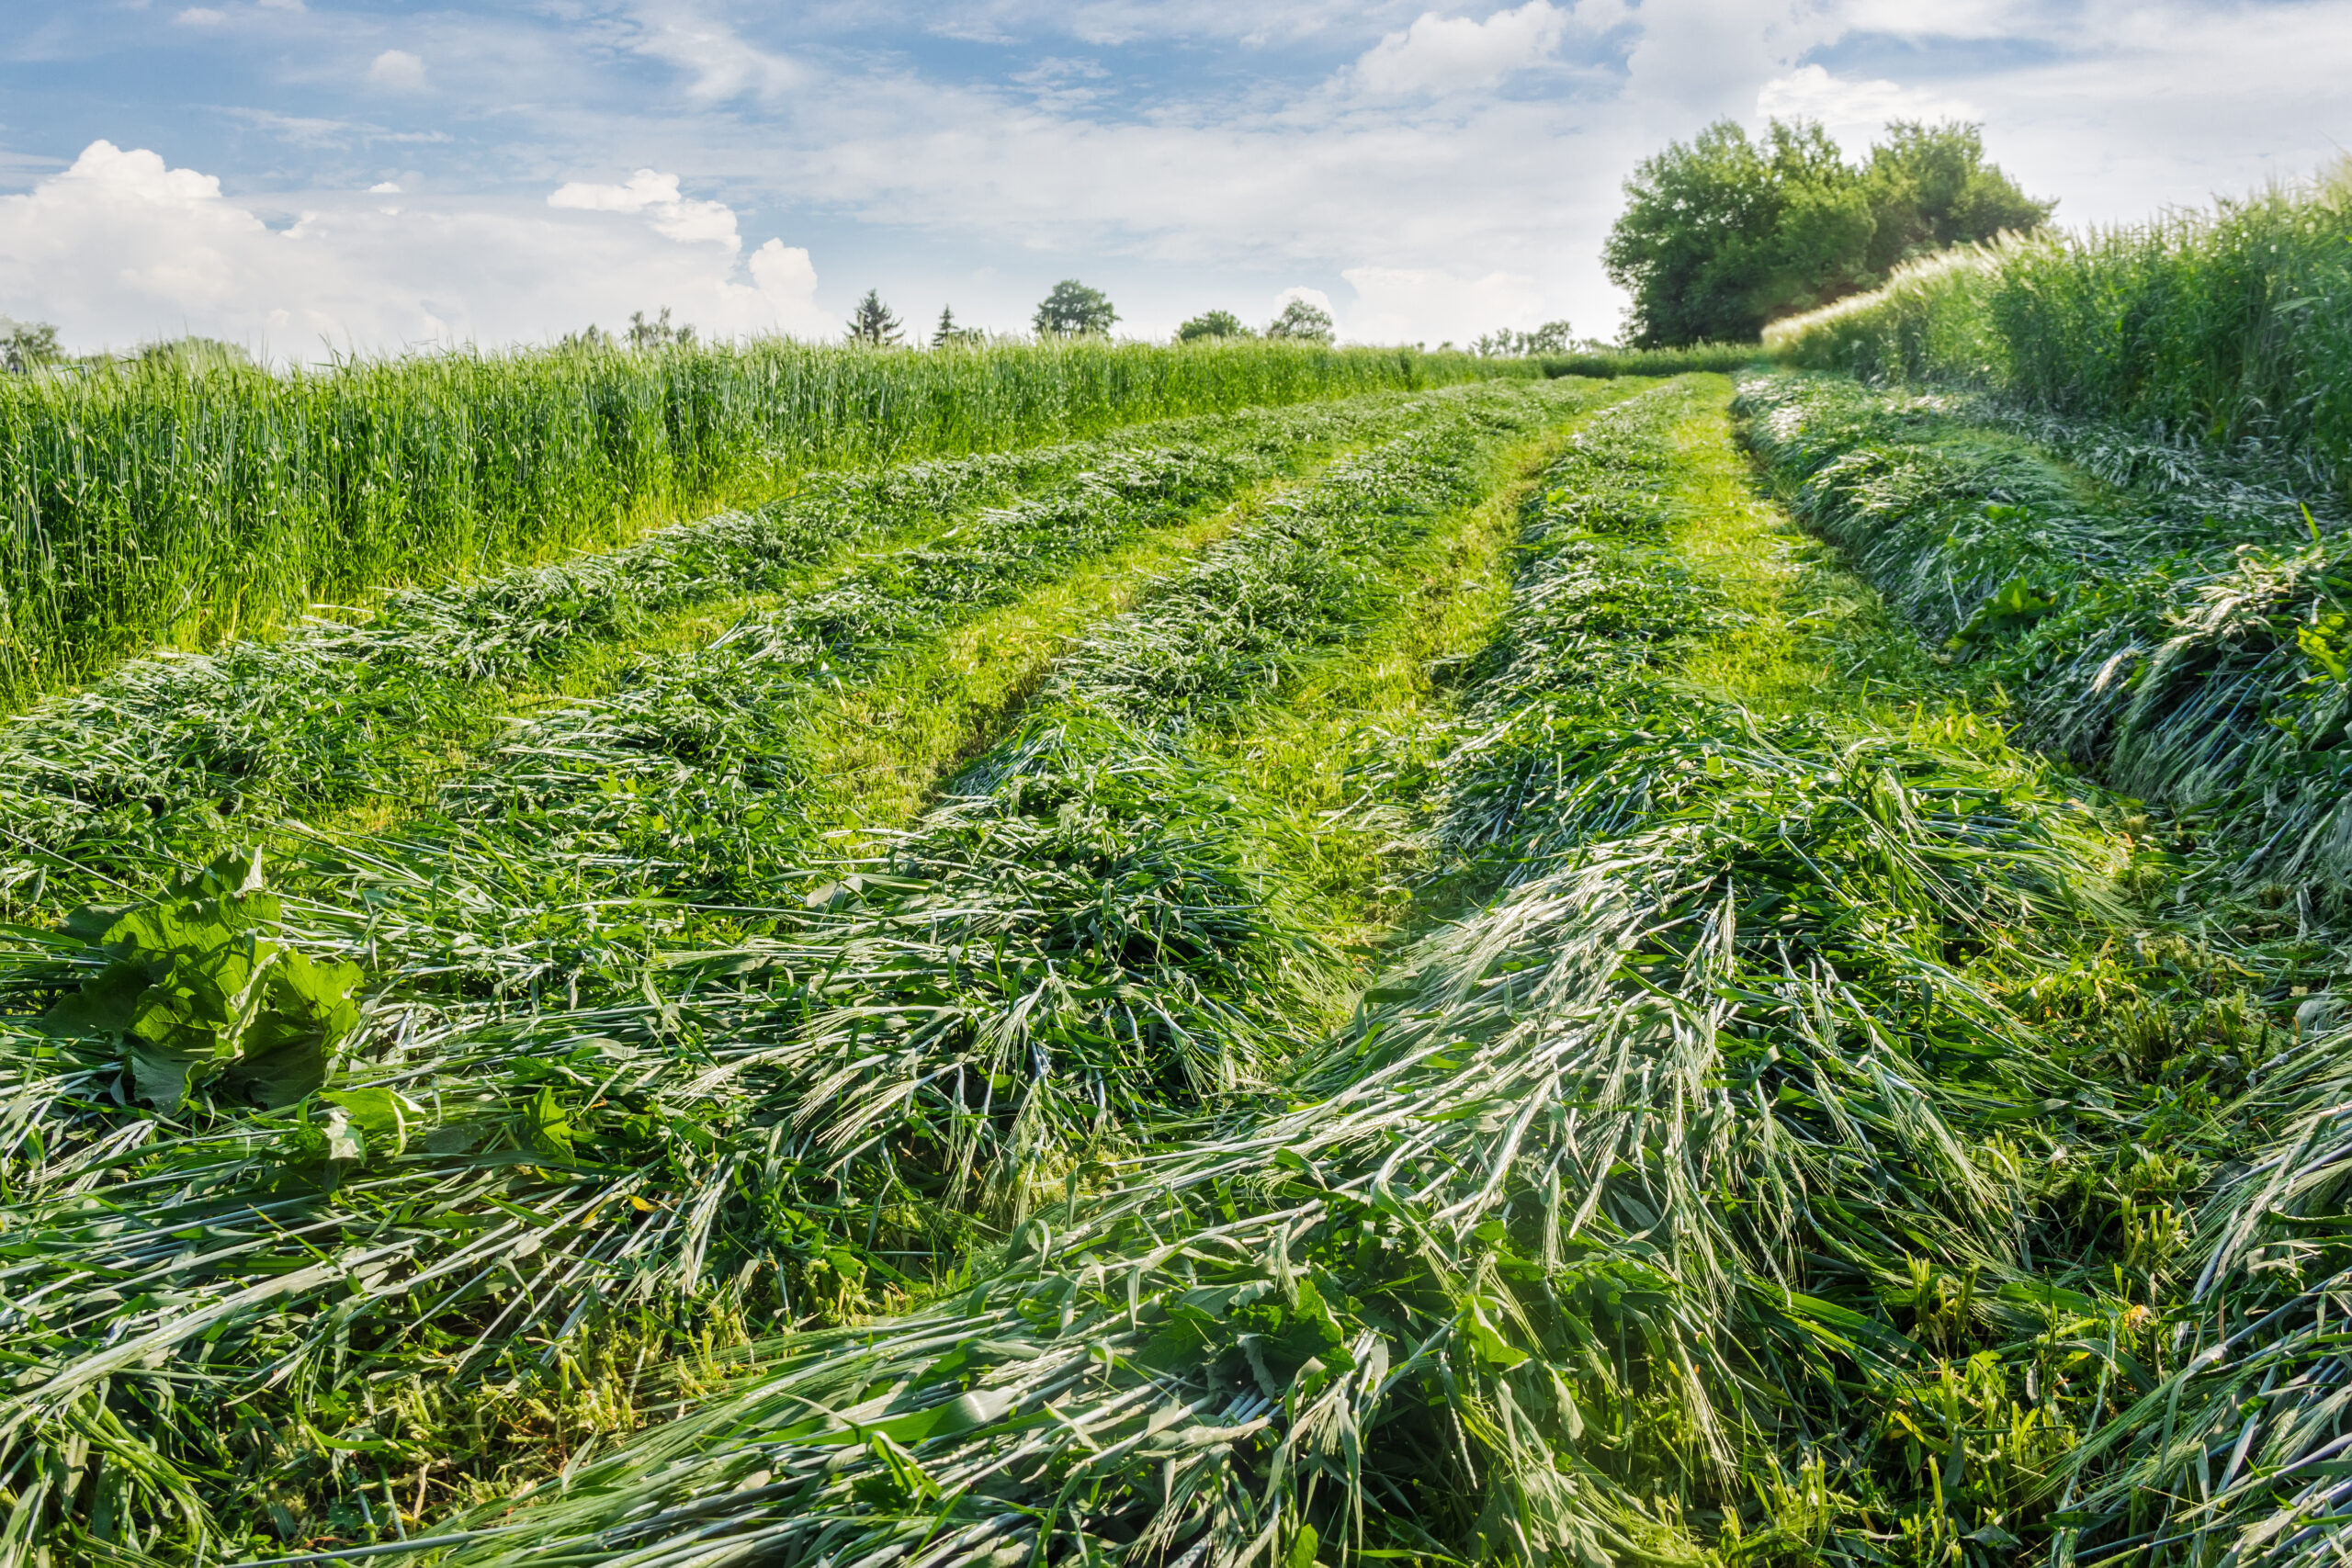
What drives the true cost of forage production?
New COP Network benchmarks reveal what drives forage production costs in Canadian cow-calf operations, from hay and silage to greenfeed, and where producers can improve efficiency.
Forage is the backbone of every cow-calf operation — but how much does it really cost to grow? While feed is often viewed as a “homegrown” input, the reality is that forage production can make or break cost competitiveness, especially as input costs continue to rise.
Data from the Canadian Cow-calf Cost of Production Network show wide differences in the cost of producing forages such as hay, corn silage, corn for grazing, cereal silage, and greenfeed. But the real insight isn’t just what those costs are, it’s why they differ from farm to farm.
Forage costs vary, management matters
This analysis includes data from 59 COP Network benchmark farms from 2020 to 2024, covering five major forage types — hay, corn silage, corn for grazing, cereal silage, and greenfeed.
Hay remains the dominant forage on Canadian cow-calf operations (with 50 samples), but it’s not always the cheapest. Benchmark results show that nearly half of hay producers had estimated costs above Alberta’s 2024 market price of $220 per tonne reported by the Agriculture Financial Services Corporation (AFSC), suggesting that in some years, buying hay could be more economical than growing it.
Over the five-year period (2020 to 2024), producers in western provinces faced larger swings due to droughts in 2021 and 2023, while eastern producers saw steady cost increases year over year.
The key cost driver for hay is not seed or fertilizer, but overhead and opportunity costs — such as machinery ownership, land value, and unpaid labour — which together make up nearly half of total cost. Managing these non-cash costs is often where the biggest savings lie.
Corn silage and corn grazing systems were generally the most cost-efficient on a dry-matter basis. Both averaged below $200 per dry tonne — but required more up-front cash investment for seed, fertilizer, and establishment. For corn silage (6 samples), 70 per cent of total costs were cash, compared to just over 50 per cent for hay. This means silage can be more demanding on working capital, even though the total cost per tonne is lower. Corn grazing (5 samples) followed similar patterns but benefited from lower inputs. Direct cash costs averaged $72 per dry tonne, compared with $86 for silage. Producers who can graze standing corn through the fall often save on harvest and feeding costs, reducing the labour and machinery expenses that drive up total costs.
Cereal silage and greenfeed were widely grown in the West, but both showed strong sensitivity to drought and yield conditions. Cereal silage’s (16 samples) estimated production cost at $82 per wet tonne were roughly in line with the 2024 Alberta market value of $77 per wet tonne, but half of the benchmark farms still produced below the market average. Greenfeed (10 samples) was the most variable and the most expensive in this dataset, with only three of ten farms producing below market value. In drought years 2021 and 2023, production costs spiked as low yields and high fertilizer prices drove up the cost per tonne.
Caution: The farms included in each forage group are not the same, meaning differences in costs may reflect variations in farm type, herd size, management practices, or growing conditions rather than the forage type itself.
Table 1. Estimated Forage Cost of Production, 2024
| Forage Type | Sample Size | Adjusted Dry Matter % | Direct Cash Cost ($/dry tonne) | Direct Cash Cost ($/wet tonne) | Total Cost ($/dry tonne) | Total Cost ($/wet tonne) | AFSC 2024 Price | Cost Structure |
|---|---|---|---|---|---|---|---|---|
| Hay | 50 | 87% | $57 | $49 | $249 | $217 | $220 | 53-15-32 |
| Corn Silage | 6 | 35% | $86 | $30 | $180 | $63 | N/A | 70-10-20 |
| Corn Grazing | 5 | 35% | $72 | $25 | $153 | $54 | N/A | 72-8-19 |
| Cereal Silage | 16 | 40% | $84 | $34 | $205 | $82 | $77 | 66-11-24 |
| Greenfeed | 10 | 85% | $114 | $97 | $281 | $239 | $187 | 60-12-28 |
- Direct Cash Cost includes: seed, fertilizer, herbicide, contract labour and other direct cash costs.
- Total Cost includes: direct cash cost, cash overhead, paid and unpaid labour, interest payment for liabilities, land rent, and opportunity cost on owned land and capital.
- AFSC 1st cut grass hay. Other data sources: $271/tonne based on AB Agriculture farm input price report; $229/tonne based on AFSC 1st cut grass hay, alfalfa hay average.
- Structure = cash cost % – depreciation % – opportunity cost %
It’s not the type of forage that determines cost competitiveness. It’s how efficiently it’s produced.
What drives direct cash costs
Direct cash costs include all the expenses required to grow forages such as seed, fertilizer, herbicide, fuel, and contract labour. These are the most visible and immediate costs to manage. Analysis of 2024 benchmark data show that fertilizer, seed, and herbicide costs were closely correlated and explained most of the variation in direct cash costs per tonne, while energy and other costs contributed less to total variation.
Interestingly, dry matter yield per acre was not significantly related to direct cash cost per tonne. This suggests higher yield doesn’t always mean higher cost efficiency. For example, farms that achieve higher yields may also spend more on fertilizer and seed. The increase in yield may simply offset these higher costs rather than reduce cost per tonne.
Chasing yield through higher input use doesn’t always lead to better efficiency. The most competitive operations focused on input effectiveness, not just input intensity.
What drives total forage production costs
When looking at total costs (including cash, depreciation, and opportunity costs), a broader picture emerges. Four main factors explained the variation across farms:
- Overhead and depreciation are the biggest factors. Cash overhead, depreciation, and unpaid labour together explained more than a quarter of the variation in total costs. This means that controlling the efficiency of resources is a crucial factor in cost control.
- Input intensity is a key driver. Higher direct cash costs also contributed to higher total costs. Farms that had higher direct cash cost had higher total production costs reinforcing the importance of managing inputs strategically.
- Land cost and debt services matters. Cost of land (owned vs. rented) and opportunity costs tied to capital investment also played a role. High land values or debt servicing increased total forage costs.
- Yield and scale are critical. Higher yield per acre and larger forage acreage are associated with lower total cost. Productivity improves efficiency by spreading overhead costs over larger output. Larger forage acreages spread overhead machinery costs across more tonnes, lowering cost per unit.
Cost competitiveness isn’t about spending less. It’s about spending smarter.
Key takeaways
- Focus on input efficiency, not yield maximization. Use soil testing, nutrient budgeting, and realistic yield targets to fine-tune fertilizer and seed rates.
- Track overhead like a cash expense. Include overhead, depreciation, unpaid labour, and land ownership costs when evaluating forage competitiveness.
- Improving soil health and crop management to support productivity along with strategic growth to achieve economies of scale, can help improve cost efficiency.
- Balance grow vs. buy decisions. Compare homegrown feed costs against market prices to guide purchasing and production strategies.
Canfax is funded by Memberships, go to www.canfax.ca to subscribe.
Leave a Comment
Latest News
-
June 12, 2026 Health & Production
What drives the true cost of forage production?
-
June 12, 2026 Checking in with ABP
ABP Working Groups address key issues
-
June 11, 2026 Business Tools
Upcoming AFSC and AgriStability deadlines for producers
Cattle Report
Updated: June 12, 2026
Steers
Live: ---
Rail: 575.00-590.00 del
Heifers
Live: ---
Rail: 575.00-590.00 del
Choice Steers
Live: ---
Rail: ---
Choice Heifers
Live: ---
Rail: ---
Boner Cows
Over 500 lbs: 334.29
Canadian Dollar
$71.54 0.00
Livestock Price Insurance Index
| Expiry | Fed | Feeder | Calf |
|---|---|---|---|
| 07-Sept-26 | 316 | 488 | -- |
| 05-Oct-26 | 310 | 486 | 618 |
| 02-Nov-26 | 300 | 478 | 600 |
| 30-Nov-26 | 298 | 466 | 592 |
| 25-Jan-27 | 294 | 460 | 596 |
| 22-Feb-27 | 294 | 454 | 600 |
| - | - | - | - |
Last Updated on June 11, 2026
Add abpdaily.com to your home screen
Tap the menu button next to the address bar or at the bottom of your browser.
Select ‘Install’ or ‘Add to Homescreen’ to stay connected.
Share this article on
About the Author
What is the COP Network? The Canadian Cow-calf Cost of Production Network (COP Network) uses standardized data collection which allows for comparison both within and between provinces, and internationally. Since launching in 2021, the COP Network has collected data from over 235 producers contributing to 64 cow-calf benchmark farms that represent various production systems. Each benchmark is based on data from 3-7 producers. Data collection occurs every 5 years with annual indexing of input and output prices, as well as crop and forage yields, in subsequent years. Individual benchmark farm summaries, can be found at: https://canfax.ca/resources/cost-of-production/cop-results.html