Live: ---
Rail: ---
{{ weatherTemp }}°C
{{ weatherCity }}
AB Direct - Steers
AB Direct - Heifers
Live: ---
Rail: ---
Rail: ---
US Trade- Steers
Live: ---
Rail: ---
Rail: ---
US Trade - Heifers
Live: ---
Rail: ---
Rail: ---
Canadian Dollar
$72.73
0.14
0.14
March 25, 2026
Checking in with ABP
Veterinary and Medicine Costs: Are you getting results?
An ounce of prevention is worth a pound of cure.
The purpose of proactive investment in veterinary and medicine (vet and med) costs is to have better health outcomes, avoiding costly treatments and reducing death losses.
However, as noted in the Optimizing Productivity fact sheet, there comes a point where more dollars spent do not necessarily provide better outcomes.
Weighing preventive programs vs. treatment costs
Preventive programs (vaccines, parasite control, mineral supplementation) may look expensive upfront but usually lowers total health costs over time.
Treatment costs (antibiotics, emergency calls, death losses) are often higher in both dollars and lost performance.
The goal is to implement a preventative herd health program that reduces the need for high treatment costs.
Vet and med costs in the COP Network averaged $39 per cow in 2024, with a range from $8 per cow to $77 per cow. However, two-thirds of the benchmark farms reported vet and med costs between $20 per cow to $40 per cow giving a median (most common) cost of $35 per cow.
These costs accounted for 4 per cent of total cash costs, with a range from 1 to 7 per cent. Some of the benchmarks with higher costs were purebred or commercial operations using artificial insemination, heat synchronization or embryo transfer.
Vet/med typically makes up 3–6 per cent of total cow-calf cash costs in Western Canada/US benchmarks. A sudden jump outside this range may signal:
- Over-medication (spending too much per head)
- Underlying herd health/nutrition problems
- Or, conversely, under-investment if low costs correlate with poor performance (open cows, dead calves).
Smaller herds with fewer than 100 cows saw the highest average costs at $46 per cow. As herd size increases, the cost per cow generally decreases, with herds of 101-200 cows averaging $40, 201-300 cows at $37, and those with more than 300 cows having the lowest average cost at $29 per cow.
This trend suggests economies of scale, where larger herds benefit from lower per-cow vet and med expenses.
Don’t just track what you spend: Track the outcomes
When asking “Am I spending too much, or not enough?”, the key is that these costs be evaluated relative to key factors.
Costs should be evaluated relative to animal performance (weaning rate, reproductive efficiency), herd health outcomes (calf death loss, treatment rates), and profitability, not just as a dollar figure per head.
Animal Health Metrics (2024)
For the COP Network, the number of calves alive after 24 hours per 100 cows exposed is used instead of conception rate, as that information is unavailable on many operations.
While this includes losses within the first 24 hours, it gets at fertility which is key for cow-calf profitability. While the averages are similar across herd sizes, there was more consistency in the larger herds, even if it was slightly lower level than the smaller operations.
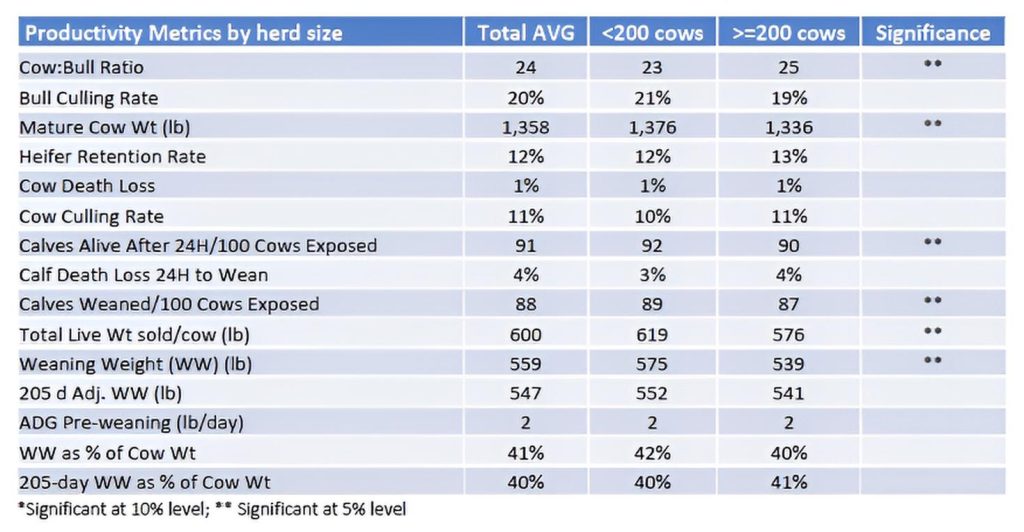
Calf death loss is calculated for calves from 24 hours old to weaning. Calf death loss averaged 4 per cent and ranged from 1 per cent to 15 per cent. The higher death loss is predator related, illustrating the influence geographic region may have on this metric.
In comparison, calf death loss from 24 hours old to weaning was reported at 2.5 per cent for calves born to cows and 2.9 per cent for calves born to heifers in the 2023 CCCS.
Weaning rate is calculated as the number of calves weaned at a percentage of the females exposed the previous year. This metrics combined conception rate and calf death loss. Weaning rates averaged 88 per cent overall (89 per cent median or most common) with a range of 74 to 96 per cent.
When evaluating return on investment (ROI), questions to ask include ‘Does spending $X lead to enough extra calves weaned, extra pounds, or fewer losses to cover the cost?’ or ‘What is the cost of under-investing?”
For example:
- A $4 vaccine that prevents 1 per cent death loss in 500-lb calves (worth $2,500-3,000 each) = very high ROI.
- Pour-ons for parasites that improve ADG by 0.1 lb/day may or may not pay depending on forage conditions.
- Skipping vaccines may save $5/calf but there is risk of losing an animal valued at $2,500 to BRD.
- Not preg-checking may “save” $6/head but those open cows eat $700 worth of feed through the winter feeding program.
Consider that high vet/med costs may indicate problems elsewhere:
- Genetics (poor mothering ability, calving difficulty, low immunity)
- Nutrition (mineral deficiencies, Body Condition Score too low at calving)
- Management (contaminated calving areas, overcrowding, inconsistent grazing rotations).
- Sometimes the cheapest way to reduce vet/med costs is to change management or cull problem cows rather than treating symptoms.
Key Takeaways:
- Preventive > Reactive – shift dollars to prevention and herd-level strategies to reduce treatment costs.
- Evaluate health outcomes (weaning %, death loss, reproductive rates) – aiming to improve outcomes relative to input costs.
- ROI focus – measure value of pounds/weaned calves saved vs. dollars spent.
- Management integration – align genetics, nutrition, and animal handling practices to lower health costs naturally.
- Benchmarking – aim for vet/med costs in line with peers while meeting or exceeding herd performance goals.
No matter where your operation is today, the most important thing is making progress.
Leave a Comment
Latest News
-
March 25, 2026 Checking in with ABP
Veterinary and Medicine Costs: Are you getting results?
-
March 24, 2026 Checking in with ABP
2026 Grazing Lease Rates Explained
-
March 24, 2026 Checking in with ABP
4-H Alberta programs and scholarships offer new opportunities for youth this spring
Cattle Report
Updated: March 25, 2026
Steers
Live: ---
Rail: ---
Heifers
Live: ---
Rail: ---
Choice Steers
Live: ---
Rail: ---
Choice Heifers
Live: ---
Rail: ---
Boner Cows
Over 500 lbs: 318.14
Canadian Dollar
$72.73 0.14
Livestock Price Insurance Index
| Expiry | Fed | Feeder | Calf |
|---|---|---|---|
| 15-Jun-26 | 310 | 468 | -- |
| 13-Jul-26 | 304 | -- | -- |
| 10-Aug-26 | 300 | 464 | -- |
| 07-Sept-26 | 294 | 464 | -- |
| 05-Oct-26 | 292 | 464 | 576 |
| 02-Nov-26 | 282 | 456 | 572 |
| 30-Nov-26 | 282 | 448 | 572 |
Last Updated on March 19, 2026

Add abpdaily.com to your home screen
Tap the menu button next to the address bar or at the bottom of your browser.
Select ‘Install’ or ‘Add to Homescreen’ to stay connected.
Share this article on
About the Author
What is the COP Network? The Canadian Cow-calf Cost of Production Network (COP Network) uses standardized data collection which allows for comparison both within and between provinces, and internationally. Since launching in 2021, the COP Network has collected data from over 235 producers contributing to 64 cow-calf benchmark farms that represent various production systems. Each benchmark is based on data from 3-7 producers. Data collection occurs every 5 years with annual indexing of input and output prices, as well as crop and forage yields, in subsequent years. Individual benchmark farm summaries, can be found at: https://canfax.ca/resources/cost-of-production/cop-results.html