Live: ---
Rail: 495.00-500.00 del

{{ weatherTemp }}°C
{{ weatherCity }}

AB Direct - Steers
AB Direct - Heifers
Live: ---
Rail: 495.00-500.00 del
Rail: 495.00-500.00 del
US Trade- Steers
Live: 224.00-225.00 (NE, IA)
Rail: 350.00-360.00 (IA, NE)
Rail: 350.00-360.00 (IA, NE)
US Trade - Heifers
Live: 224.00-225.00 (NE, IA)
Rail: 350.00-360.00 (IA, NE)
Rail: 350.00-360.00 (IA, NE)
Canadian Dollar
$71.61
0.13
0.13
October 30, 2026
Business Tools
Finding the right balance between productivity and profitability
A cow-calf operation can produce more pounds of beef without becoming more profitable.
That may seem counterintuitive, but productivity and profitability are not the same thing. Increasing weaning weights, improving reproductive performance or reducing calf losses can all add revenue, but they may also require additional feed, labour, breeding, health or capital investment.
The question is not simply “How productive is my herd?” A more useful question is: “Which productivity metrics are contributing to my bottom line?”
The 2025 Canadian Cow-Calf Cost of Production (COP) Network provides an opportunity to explore this question. Its 60 benchmark farms represent a wide range of environments, herd sizes and management systems across Canada.
The average cow herd size of the benchmark farms is 204, ranging from 24 to 950 cows. Twenty-seven percent of the benchmark farms had fewer than 100 cows, while 15 per cent had more than 300 cows.
Larger and smaller operations may have different cost structures, labour requirements and management priorities. To account for this, the COP benchmarks were divided into herds with fewer than 200 cows and those with 200 or more cows. Within each group, benchmark farms were also divided into the top third and bottom two-thirds based on medium-term profitability (returns after covering cash cost and depreciation).
Less than 200 beef cows: survival and calf performance matters
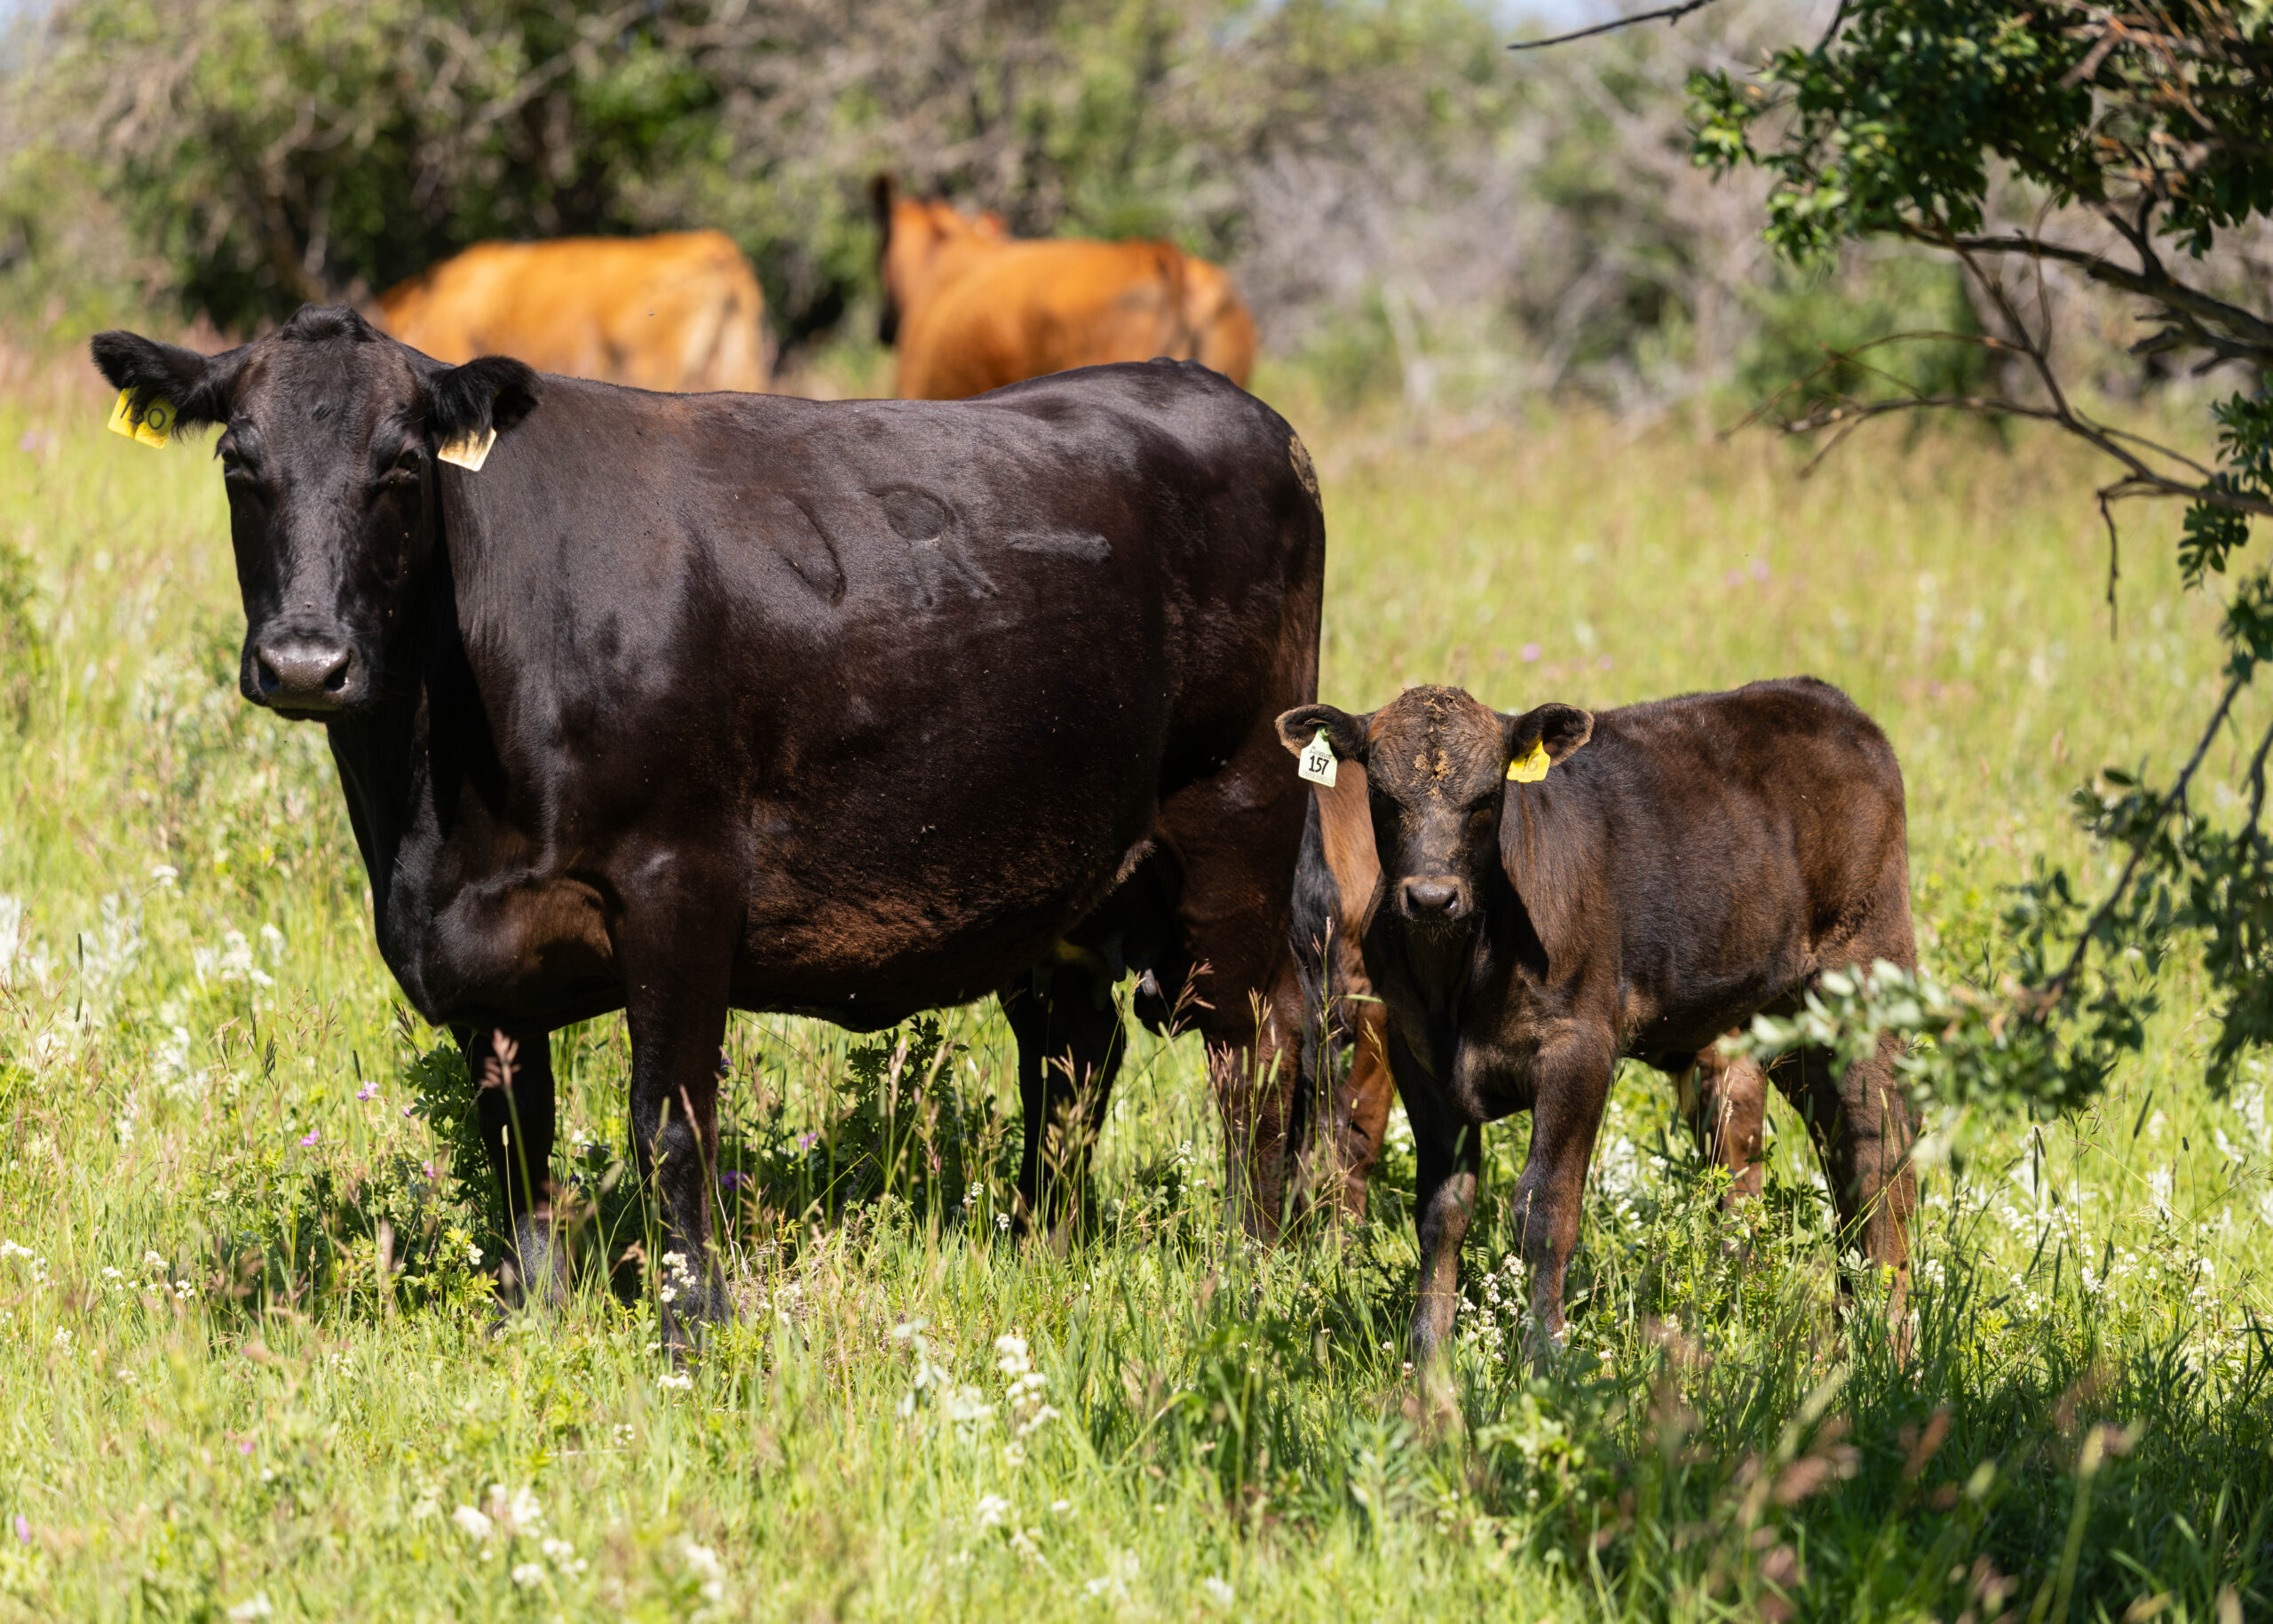
Among herds with less than 200 cows, six productivity measures were statistically different between the top third and bottom two-thirds of farms (Table 1). While the differences were generally modest, the more profitable farms had a lower heifer retention rate (11 per cent versus 13 per cent) and lower cow death loss (1.2 per cent versus 1.8 per cent), while producing more calves alive after 24 hours, more calves weaned, and heavier 205-day adjusted weaning weights.
Heifer retention and cow death loss are connected. When more cows die, additional heifers need to be retained to maintain herd size. This reduces the number of heifers available for sale.
In 2025, record-high cattle prices increased the potential value of each additional calf weaned and each additional pound sold. This may help explain why calf survival and weaning performance stood out among the smaller herds. With a smaller herd, even a few additional calves weaned or additional pounds per calf can make a noticeable difference to the farm’s total revenue.
These results suggest that improving calf survival and weaning performance may be worthwhile areas to investigate. However, the economic benefit will depend on the cost of making improvements and how they affect the rest of the operation.
Table 1. Productivity metrics for benchmarks with fewer than 200 cows
| Productivity metric | Total avg. | Bottom 2/3 | Top 1/3 | Significance |
|---|---|---|---|---|
| Cow ratio | 23 | 23 | 22 | |
| Bull culling rate | 22% | 24% | 18% | |
| Mature cow weight (lb) | 1,359 | 1,345 | 1,384 | |
| Heifer retention rate | 12% | 13% | 11% | * |
| Cow death loss | 1.6% | 1.8% | 1.2% | * |
| Cow culling rate | 10% | 11% | 10% | |
| Calves alive after 24h/100 exposed | 92 | 91 | 94 | ** |
| Calf death loss 24h to wean | 3% | 3% | 3% | |
| Calves weaned/100 cows exposed | 89 | 88 | 91 | ** |
| Total live weight sold/cow (lb) | 612 | 606 | 625 | |
| Weaning weight (lb) | 572 | 565 | 584 | |
| 205-day adjusted weaning weight (lb) | 548 | 536 | 571 | ** |
| ADG pre-weaning (lb/day) | 2.3 | 2.2 | 2.4 | ** |
| Weaning weight as % of cow weight | 42% | 42% | 42% | |
| 205-day weaning weight as % of cow weight | 40% | 40% | 41% |
Significance: * at the 10 per cent level; ** at the 5 per cent level. Farms ranked by medium-term profitability (returns after covering cash cost and depreciation).
More than 200 beef cows: getting more calves to weaning matters
For herds with more than 200 cows, only two productivity measures were statistically different between the top third and bottom two-thirds (Table 2). The top-third farms weaned 89 calves per 100 cows exposed, compared with 85 for the bottom two-thirds. Calf death loss was 2 per cent, compared with 5 per cent for the bottom two-thirds. Weaning weights were similar between the groups and not statistically different, with 549 lb for the bottom two-thirds compared with 552 lb for the top third.
In 2025, profitability among the larger herds was more closely associated with calf survival and the number of calves weaned rather than individual weaning weight. When weaning weights are already similar, preventing calf losses may offer more economic value than pushing weights higher.
The results do not mean that heavier calves are unimportant. Rather, they suggest that producers should assess where improvements have the greatest potential to increase returns relative to their cost.
Table 2. Productivity metrics for benchmarks with more than 200 cows
| Productivity metric | Total avg. | Bottom 2/3 | Top 1/3 | Significance |
|---|---|---|---|---|
| Cow ratio | 24 | 24 | 25 | |
| Bull culling rate | 19% | 21% | 16% | |
| Mature cow weight (lb) | 1,335 | 1,322 | 1,363 | |
| Heifer retention rate | 13% | 13% | 14% | |
| Cow death loss | 1% | 1.4% | 1.5% | |
| Cow culling rate | 12% | 12% | 12% | |
| Calves alive after 24h/100 exposed | 90 | 89 | 91 | |
| Calf death loss 24h to wean | 4% | 5% | 2% | ** |
| Calves weaned/100 cows exposed | 86 | 85 | 89 | ** |
| Total live weight sold/cow (lb) | 585 | 577 | 602 | |
| Weaning weight (lb) | 550 | 549 | 552 | |
| 205-day adjusted weaning weight (lb) | 549 | 546 | 555 | |
| ADG pre-weaning (lb/day) | 2 | 2 | 2 | |
| Weaning weight as % of cow weight | 41% | 42% | 40% | |
| 205-day weaning weight as % of cow weight | 41% | 41% | 41% |
Significance: * at the 10 per cent level; ** at the 5 per cent level. Farms ranked by medium-term profitability (returns after covering cash cost and depreciation).
Use benchmarks to start the conversation
Productivity measures are often treated as targets, but a number alone does not tell the whole story. Higher production can increase revenue while also increasing costs or creating trade-offs elsewhere in the operation.
The key question is: When does the cost of additional production exceed the value it creates? The answer will vary by farm and market conditions.
For example, more intensive monitoring or intervention may improve calf survival, but it also requires labour. If labour is already limited, those extra hours may take time away from other farm activities.
Similarly, adding weight to calves may make economic sense when feed costs are favourable and calf prices are strong, but the value of additional pounds changes with market conditions.
Benchmarks help producers see where their operation differs from comparable farms and identify areas worth a closer look. Being above or below a benchmark does not automatically mean a change is needed.
Consider four questions:
- Where does my operation differ from the benchmarks?
- Does that difference affect my bottom line?
- What would it cost to improve?
- How would a change affect the rest of my operation?
The goal is not to maximize every productivity measure. It is to find the level of productivity that makes economic sense for the operation.
Key takeaways
- More productivity does not always mean more profit. The cost of achieving additional production matters.
- The productivity metrics associated with profitability can differ for every farm and can change from year to year.
- Use benchmarks to identify opportunities, not as targets that every operation needs to reach.
- Look at the whole system. A change in one productivity measure can affect other parts of the operation.
Source: Canfax Research Services, Canadian Cow-Calf Cost of Production Network.
Canfax is funded by Memberships, go to www.canfax.ca to subscribe.
Leave a Comment

Latest News
-
October 30, 2026 Business Tools
Finding the right balance between productivity and profitability
-
October 29, 2026 News
AAFC launches consultation on agricultural research priorities
-
October 29, 2026 Checking in with ABP
CCA's fall priorities: Protecting markets and supporting producers
Cattle Report
Updated: October 29, 2026
Steers
Live: ---
Rail: 495.00-500.00 del
Heifers
Live: ---
Rail: 495.00-500.00 del
Choice Steers
Live: 224.00-225.00 (NE, IA)
Rail: 350.00-360.00 (IA, NE)
Choice Heifers
Live: 224.00-225.00 (NE, IA)
Rail: 350.00-360.00 (IA, NE)
Boner Cows
Over 500 lbs: 253.88
Canadian Dollar
$71.61 0.13
Livestock Price Insurance Index
| Expiry | Fed | Feeder | Calf |
|---|---|---|---|
| 25-Jan-27 | 290 | 468 | -- |
| 22-Feb-27 | 290 | 460 | -- |
| 22-Mar-27 | 294 | 460 | -- |
| 19-Apr-27 | 300 | 456 | -- |
| 17-May-27 | 306 | 460 | -- |
| 14-Jun-27 | 310 | 462 | -- |
| 12-Jul-27 | 302 | -- | -- |
Last Updated on October 29, 2026

Add abpdaily.com to your home screen
Tap the menu button next to the address bar or at the bottom of your browser.
Select ‘Install’ or ‘Add to Homescreen’ to stay connected.
Share this article on
About the Author
The Canadian Cow-Calf Cost of Production Network (COP Network) is presented by Canfax Research Services, funded by the Beef Cattle Research Council, and delivered in partnership with provincial partners. The COP Network uses standardized data collection which allows for comparison both within and between provinces, and internationally. Since launching in 2021, the COP Network has collected data from over 235 producers contributing to 64 cow-calf benchmark farms that represent various production systems. Each benchmark is based on data from 3-7 producers. Data collection occurs every five years with annual indexing of input and output prices, as well as crop and forage yields, in subsequent years. Individual benchmark farm summaries, can be found at: https://canfax.ca/resources/cost-of-production/cop-results.html