Live: ---
Rail: ---

{{ weatherTemp }}°C
{{ weatherCity }}

AB Direct - Steers
AB Direct - Heifers
Live: ---
Rail: ---
Rail: ---
US Trade- Steers
Live: ---
Rail: ---
Rail: ---
US Trade - Heifers
Live: ---
Rail: ---
Rail: ---
Canadian Dollar
$70.45
0.07
0.07
September 16, 2026
Current Markets & Forecasts
Whole-farm financial benchmarks: Set the profit goal first
Record cattle prices can make almost any operation look profitable. But strong markets can also hide inefficiencies that become more apparent when prices weaken.
As the cattle cycle moves into its next phase, protecting equity and maintaining a strong financial position will become increasingly important. That starts with setting a clear profit goal and working backward to determine what the operation must do to achieve it.
Research has shown a connection between strong financial performance and sound business management practices. Farm Management Canada’s Dollars and Sense study found that practices such as maintaining a written business plan, monitoring cost of production and regularly updating budgets and financial plans were associated with profitability improvements ranging from $10,000 to $160,000.
The path will look different for every farm. Some operations may need to make significant changes to their cost structure or enterprise mix. Others may be able to reach their goals through smaller, steady improvements.
Taking a whole-farm view
The Canadian Cow-Calf Cost of Production Network provides standardized benchmarks that allow producers to compare financial and production performance within and between provinces.
Since launching in 2021, the network has collected data from more than 200 producers contributing to 60 benchmark farms representing a range of cow-calf production systems. Each benchmark is based on information from three to seven producers.
Because farms differ in herd size, enterprise mix, off-farm income and diversification, whole-farm benchmarks provide a broader picture than production measures alone. They examine a farm’s ability to generate revenue relative to its operating costs and asset base.
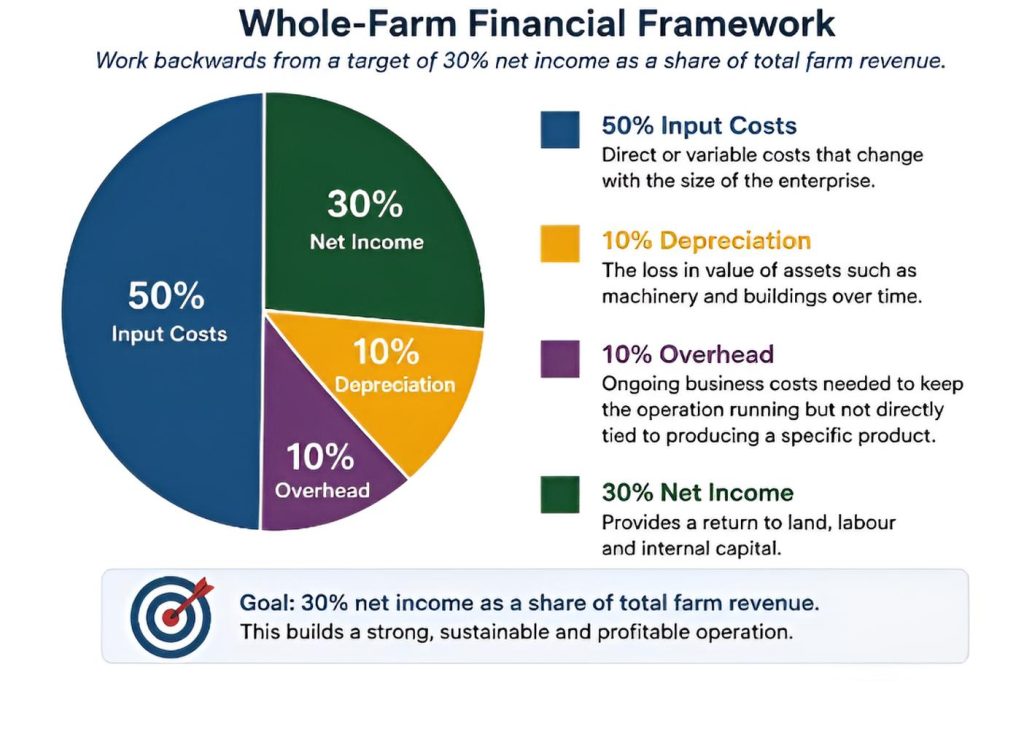
The network works backward from a target in which net income represents 30 per cent of total farm revenue:
- 50 per cent for input costs
- 10 per cent for depreciation
- 10 per cent for overhead
- 30 per cent for net income
Input costs are direct or variable expenses that change with the size of an enterprise. Depreciation accounts for the declining value of machinery, buildings and other assets, while overhead includes the ongoing costs required to operate the business that are not directly tied to producing a particular product.
The 30 per cent net-income target is intended to provide a return to the land, labour and capital invested in the farm.
Benchmark against profitable farms
The Cost of Production Network’s financial benchmarks are based on its most profitable farms, rather than its most productive farms.
In 2025, farms in the top third based on medium-term profitability recorded net income equal to 46 per cent of total farm revenue. By comparison, farms in the bottom two-thirds averaged net income of 17 per cent of revenue.
Input costs were relatively similar between the two groups, accounting for 42 per cent of revenue among the top third and 43 per cent among the bottom two-thirds.
The larger differences were found elsewhere. Depreciation accounted for seven per cent of revenue among the top third, compared with 10 per cent among the bottom two-thirds. Overhead represented eight per cent of revenue for the top group and 13 per cent for the remaining farms.
The results suggest some of the largest opportunities to improve profitability may be found outside day-to-day production. Machinery, buildings and the overall structure of the farm can have a substantial impact on the bottom line.
How does your farm compare?
Benchmarks are not intended to put every operation into the same box. Instead, they provide a starting point for identifying opportunities to become more competitive and financially resilient.
Producers can begin by asking three questions:
- Am I satisfied with net income as a percentage of total farm revenue?
A clear answer establishes whether the operation is already meeting its financial goals or whether may be needed. - Where do my costs differ from the benchmarks?
If depreciation or overhead is well above 10 per cent, consider whether the farm’s structure can support those costs over the long term. If input costs exceed 50 per cent, determine whether they are generating greater productivity and revenue or masking a deeper issue. - If costs are under control, is revenue the opportunity?
When the cost structure is sound, changes to marketing, enterprise mix or production may offer opportunities to increase income.
Start with the result you want
There is no single financial plan that will work for every farm. Producers should begin with the result they want and work backward by considering:
- How much income is needed to meet the farm’s financial goals?
- What is the farm producing, and at what expected price?
- How many head must be marketed to reach the goal?
- Is the goal realistic for the operation?
- What changes are required to get there?
Setting the profit goal first gives the operation a clear destination. Knowing the numbers, comparing them against appropriate benchmarks and identifying where changes will have the greatest impact can help producers build stronger businesses.
Not everything needs to change at once. Small, deliberate improvements help move the whole farm int he right direction.
More information and individual benchmark farm summaries are available through the Canadian Cow-Calf Cost of Production Network.
This story is adapted from the full COP Network article available here.
Canfax is funded by memberships, go to www.canfax.ca to subscribe.
Share this article on



Latest News
-
October 6, 2026 Checking in with ABP
Alberta cattle markets remain strong and steady
-
October 5, 2026 News
New tax deduction aims to encourage investment in agriculture and agribusiness
-
October 5, 2026 Checking in with ABP
Young Creators Contest returns for a third year
Cattle Report
Updated: October 6, 2026
Steers
Live: ---
Rail: ---
Heifers
Live: ---
Rail: ---
Choice Steers
Live: ---
Rail: ---
Choice Heifers
Live: ---
Rail: ---
Boner Cows
Over 500 lbs: 268.08
Canadian Dollar
$70.45 0.07
Livestock Price Insurance Index
| Expiry | Fed | Feeder | Calf |
|---|---|---|---|
| 25-Jan-27 | 286 | 460 | -- |
| 22-Feb-27 | 286 | 452 | -- |
| 22-Mar-27 | 288 | 450 | -- |
| 19-Apr-27 | 294 | 446 | -- |
| 17-May-27 | 300 | 452 | -- |
| 14-Jun-27 | 304 | 456 | -- |
| - | - | - | - |
Last Updated on October 1, 2026